| Portfolio Holdings |
| Issuer |
% to net Assets |
Rating |
| Consumer Durables |
10.64% |
|
| Titan Company Limited |
3.60% |
|
| Voltas Limited |
2.69% |
|
| Asian Paints Limited |
2.48% |
|
| Hindware Home Innovation Limited |
1.68% |
|
| Kansai Nerolac Paints Limited |
0.19% |
|
| Industrial Products |
9.83% |
|
| Cummins India Limited |
3.24% |
|
| AIA Engineering Limited |
2.50% |
|
| Bharat Forge Limited |
1.97% |
|
| Greaves Cotton Limited |
1.05% |
|
| TIMKEN INDIA LTD |
0.74% |
|
| AGI Greenpac Limited |
0.32% |
|
| Pharmaceuticals & Biotechnology |
8.59% |
|
| Sun Pharmaceutical Industries Limited |
2.38% |
|
| Glenmark Pharmaceuticals Limited |
1.99% |
|
| Strides Pharma Science Limited |
1.97% |
|
| Mankind Pharma Ltd |
1.45% |
|
| Aarti Pharmalabs Ltd |
0.43% |
|
| Solara Active Pharma Sciences Limited |
0.37% |
|
| Automobiles |
7.50% |
|
| Mahindra & Mahindra Limited |
3.22% |
|
| Maruti Suzuki India Limited |
1.65% |
|
| Eicher Motors Limited |
1.56% |
|
| Hero MotoCorp Limited |
1.07% |
|
| Beverages |
7.36% |
|
| United Breweries Limited |
3.30% |
|
| Radico Khaitan Limited |
2.24% |
|
| United Spirits Limited |
1.82% |
|
| Aerospace & Defense |
6.95% |
|
| Bharat Electronics Limited |
6.95% |
|
| Petroleum Products |
6.89% |
|
| Reliance Industries Limited |
6.89% |
|
| Diversified FMCG |
6.32% |
|
| ITC Limited |
3.66% |
|
| Hindustan Unilever Limited |
2.66% |
|
| Ferrous Metals |
5.87% |
|
| Tata Steel Limited |
3.40% |
|
| Shyam Metalics & Energy Limited |
1.97% |
|
| NMDC Steel Ltd |
0.50% |
|
| Industrial Manufacturing |
3.21% |
|
| GMM Pfaudler Limited |
3.21% |
|
| Paper Forest & Jute Products |
2.86% |
|
| Century Textiles & Industries Limited |
2.86% |
|
| Chemicals & Petrochemicals |
2.81% |
|
| Aarti Industries Limited |
2.81% |
|
| Non - Ferrous Metals |
2.48% |
|
| Hindalco Industries Limited |
2.48% |
|
| Agricultural Food & other Products |
1.93% |
|
| Tata Consumer Products Limited |
1.93% |
|
| Cement & Cement Products |
1.85% |
|
| ACC Limited |
1.34% |
|
| HeidelbergCement India Limited |
0.52% |
|
| Auto Components |
1.73% |
|
| Endurance Technologies Limited |
1.73% |
|
| Others |
1.73% |
|
| TD Power Systems Ltd |
1.73% |
|
| Construction |
1.46% |
|
| Larsen & Toubro Limited |
1.46% |
|
| Electrical Equipment |
1.35% |
|
| TRIVENI TURBINE LTD |
1.35% |
|
| Textiles & Apparels |
1.24% |
|
| Kewal Kiran Clothing Limited |
1.24% |
|
| Minerals & Mining |
1.08% |
|
| NMDC Limited |
1.08% |
|
| Food Products |
0.52% |
|
| Prataap Snacks Limited |
0.52% |
|
| Cash & Current Assets |
5.80% |
|
| Total Net Assets |
100.00% |
|
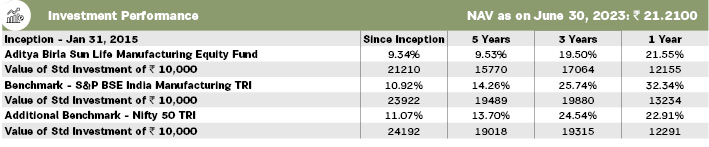
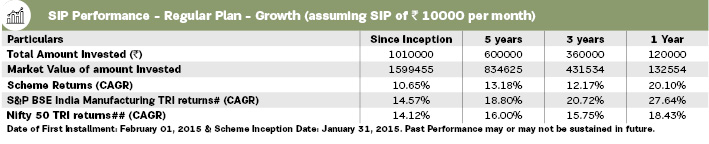
# Scheme Benchmark, ## Additional Benchmark, * As on start of period considered above.
For SIP calculations above, the data assumes the investment of
10000/- on 1st day of every month or the subsequent working day. Load & Taxes
are not considered for computation of returns. Performance for IDCW option would assume reinvestment of tax free IDCW declared at the
then prevailing NAV. CAGR returns are computed after accounting for the cash flow by using XIRR method (investment internal rate of return).Where
Benchmark returns are not available, they have not been shown. Past performance may or may not be sustained in future. Returns greater than
1 year period are compounded annualized. IDCW are assumed to be reinvested and bonus is adjusted. Load is not taken into consideration. For SIP
returns, monthly investment of equal amounts invested on the 1st day of every month has been considered.