| Portfolio Holdings |
| Issuer |
% to net Assets |
Rating |
| Banks |
26.62% |
|
| HDFC Bank Limited |
8.86% |
|
| ICICI Bank Limited |
7.71% |
|
| Kotak Mahindra Bank Limited |
3.20% |
|
| Axis Bank Limited |
3.19% |
|
| State Bank of India |
2.59% |
|
| IndusInd Bank Limited |
1.06% |
|
| IT - Software |
12.61% |
|
| Infosys Limited |
5.62% |
|
| Tata Consultancy Services Limited |
3.99% |
|
| HCL Technologies Limited |
1.48% |
|
| Tech Mahindra Limited |
0.83% |
|
| Wipro Limited |
0.68% |
|
| Petroleum Products |
10.59% |
|
| Reliance Industries Limited |
10.18% |
|
| Bharat Petroleum Corporation Limited |
0.41% |
|
| Finance |
9.31% |
|
| Housing Development Finance Corporation Limited |
6.08% |
|
| Bajaj Finance Limited |
2.25% |
|
| Bajaj Finserv Limited |
0.98% |
|
| Diversified FMCG |
7.52% |
|
| ITC Limited |
4.70% |
|
| Hindustan Unilever Limited |
2.82% |
|
| Automobiles |
5.96% |
|
| Mahindra & Mahindra Limited |
1.54% |
|
| Maruti Suzuki India Limited |
1.53% |
|
| Tata Motors Limited |
1.24% |
|
| Bajaj Auto Limited |
0.63% |
|
| Eicher Motors Limited |
0.58% |
|
| Hero MotoCorp Limited |
0.45% |
|
| Construction |
3.53% |
|
| Larsen & Toubro Limited |
3.53% |
|
| Consumer Durables |
3.29% |
|
| Asian Paints Limited |
1.79% |
|
| Titan Company Limited |
1.50% |
|
| Pharmaceuticals & Biotechnology |
3.25% |
|
| Sun Pharmaceutical Industries Limited |
1.34% |
|
| Dr. Reddys Laboratories Limited |
0.74% |
|
| Cipla Limited |
0.63% |
|
| Divi's Laboratories Limited |
0.54% |
|
| Telecom - Services |
2.60% |
|
| Bharti Airtel Limited |
2.60% |
|
| Power |
2.09% |
|
| NTPC Limited |
1.06% |
|
| Power Grid Corporation of India Limited |
1.03% |
|
| Ferrous Metals |
1.92% |
|
| Tata Steel Limited |
1.07% |
|
| JSW Steel Limited |
0.85% |
|
| Cement & Cement Products |
1.88% |
|
| UltraTech Cement Limited |
1.13% |
|
| Grasim Industries Limited |
0.75% |
|
| Food Products |
1.66% |
|
| Nestle India Limited |
0.96% |
|
| Britannia Industries Limited |
0.70% |
|
| Insurance |
1.52% |
|
| HDFC Life Insurance Company Limited |
0.83% |
|
| SBI Life Insurance Company Limited |
0.69% |
|
| Metals & Minerals Trading |
0.87% |
|
| Adani Enterprises Limited |
0.87% |
|
| Oil |
0.74% |
|
| Oil & Natural Gas Corporation Limited |
0.74% |
|
| Transport Infrastructure |
0.73% |
|
| Adani Ports and Special Economic Zone Limited |
0.73% |
|
| Non - Ferrous Metals |
0.73% |
|
| Hindalco Industries Limited |
0.73% |
|
| Consumable Fuels |
0.62% |
|
| Coal India Limited |
0.62% |
|
| Healthcare Services |
0.61% |
|
| Apollo Hospitals Enterprise Limited |
0.61% |
|
| Agricultural Food & other Products |
0.60% |
|
| Tata Consumer Products Limited |
0.60% |
|
| Fertilizers & Agrochemicals |
0.41% |
|
| UPL Limited |
0.41% |
|
| Cash & Current Assets |
0.37% |
|
| Total Net Assets |
100.00% |
|
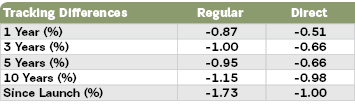
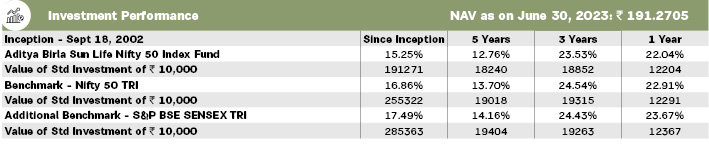
# Scheme Benchmark, ## Additional Benchmark, * As on start of period considered above.
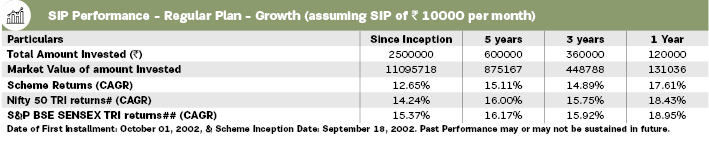
For SIP calculations above, the data assumes the investment of
10000/- on 1st day of every month or the subsequent working day. Load & Taxes
are not considered for computation of returns. Performance for IDCW option would assume reinvestment of tax free IDCW declared at the
then prevailing NAV. CAGR returns are computed after accounting for the cash flow by using XIRR method (investment internal rate of return).Where
Benchmark returns are not available, they have not been shown. Past performance may or may not be sustained in future. Returns greater than
1 year period are compounded annualized. IDCW are assumed to be reinvested and bonus is adjusted. Load is not taken into consideration. For SIP
returns, monthly investment of equal amounts invested on the 1st day of every month has been considered.